
Social Security analysis is about so much more than JUST Social Security. It is also about the other income an individual receives while on Social Security. Social Security analysis is also about so much more than just “crossover point analysis“ that many of us have seen. Crossover analysis is done by looking at the cumulative benefits of Social Security by filing at 62, 67, 70, etc., and which one comes out better at certain points in time in the future. This type of analysis is oversimplified for various reasons (taxes, time value of money, etc.). Let me explain by using my Monte Carlo Software.
As I go over this analysis, you will find that this conversation is about so much more than just projecting how long one will live then selecting the best timing based off our expectations. There is much more to it than that when you take into consideration taxes and RMDs. As I often tell my clients and agents that I will reiterate from my first sentence, “Social Security optimization is about so much more than JUST Social Security. It is also about the other retirement income that can add to Social Security Taxation.”
“Social Security optimization is about so much more than JUST Social Security. It is also about the other retirement income that can add to Social Security Taxation.”
Example client
Here is our example client. I’m simplifying it with one individual – Johnny – who was born in 1960 and has a full retirement age (Per Social Security) of 67 and his Social Security statement shows at full retirement age his benefit amount is $2,000 per month. That is his “primary insurance amount”. He also has a $1 million stock/bond portfolio (50/50) that is all Pre-Tax IRA money . Johnny wants to retire next year, the year 2025. Johnny is hoping that he can get at least $50,000 per year in today’s after-tax dollars in retirement income. That income he needs to adjust for inflation each year until he dies. What is his “retirement number” as I call it? That is what Monte Carlo simulations solve for.
In short, what Monte Carlo simulations do is it answers the question of “when Johnny retires, how much is it in today’s dollars that he can take in retirement income among all of his sources of income so that he statistically does not run out of money?” The system will come back with a dollar amount that he “should” be able to take in order to last him his lifetime – which I put in as age 92. I wanted to be aggressive with the lifespan because I want to be conservative with his retirement income, so he does not run out of money. Furthermore, the amount of income that the system comes back with is based off of a 95% confidence rate, which I won’t go into here. It’s irrelevant to this article.
Layering approach
The first scenario is what I call the “layering approach”. This is when consumers automatically file for Social Security once they retire, age 65 in Johnny’s case, and then just layer on top of it his portfolio income, which is 100% pretax in our simplified example. So the question is, what is the after-tax dollar amount that Johnny can take his first year of retirement, and then adjusting for inflation each year thereafter by taking this approach? The system came back with the following.
Chart 1:
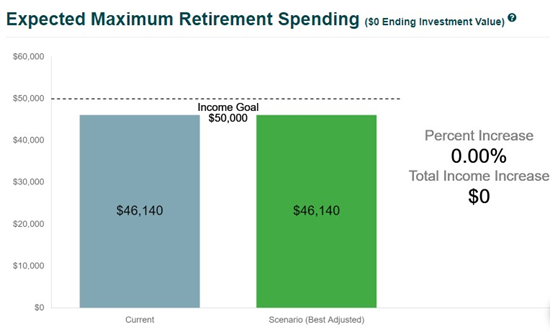
As you can see, $46,140, which is almost $4,000 short of our goal that Johnny wanted – of $50,000 in retirement income. Currently there is no difference between the box on the left and the box on the right. However, once we start to optimize his income by adjusting Social Security, you will see the box on the right, which is the plan, increase.
Now below in chart 2 is what I mean by “layering”. What Johnny did was he took Social Security blindly at age 65 because he did not have a glorious agent like yourself to advise him on other strategies. But then on top of the Social Security he just blindly took from whatever portfolio he had, which was all qualified money. The lack of “coordination” among various income sources is quite common with the average consumer. Just blindly take what you need and “layering” it on top of your Social Security!!! When folks cook meals, they usually “coordinate” the various sides, main courses, etc. The below is equivalent to eating a Ribeye along with a glass of chocolate milk.
Chart 2:
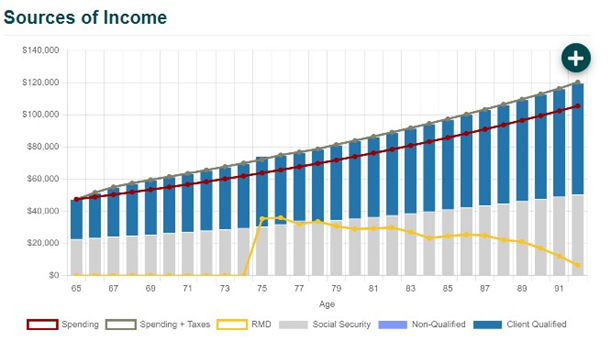
The grey bar is his Social Security, which is slightly penalized because he took it two years early, and the blue bar is his withdrawals from his $1 million portfolio. $22,794 is coming from Social Security and the difference of $24,730 comes from his portfolio. The total of those two numbers is $47,524. That is, $46,140 but with one year of Inflation adjustments, since he is retiring next year.
For you annuity folks, you are reading that correctly! The system is saying that on an inflation adjusted basis, only $24,730 can be taken from his $1 million portfolio to be sustainable until age 92 based off a 95% confidence! Yes, there is an annuity sale here, but not in this article…
The red line is how much the system projects he can take on an after-tax basis, and the green line represents the amount he needs to withdraw from his portfolio in order to get the red line, after the taxes have been paid. In short, the “lines” are how much his expenditures are in retirement, and the “bars” are how he finances them. By the way, notice the yellow line. That is his required minimum distributions, which are approximately $35,000 when he turns age 75.
The bucketing approach
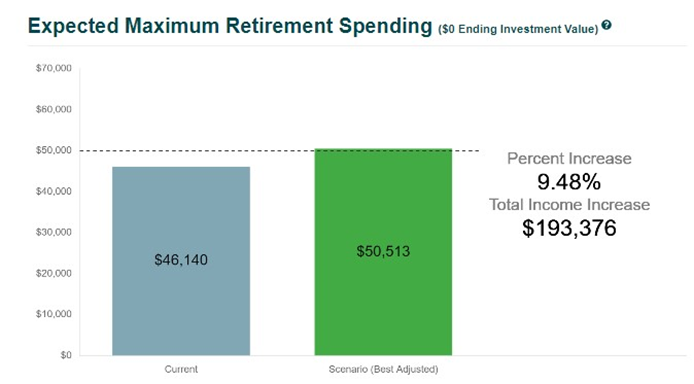
So now what I did was, I asked the system “what is the optimal Social Security filing age from an after-tax income standpoint based off our assumptions?” Check out our green box below in chart 3. This is where our green box starts to deviate from our original “layering” scenario and where we start to truly help our clients!!! How are we able to get him almost 10% additional income based off of the projections? The system says by filing for Social Security at age 70.
Chart 3:
Now, filing at age 70 giving Johnny more income over his life may be no surprise to you, but what may be surprising is what all contributed to getting more after-tax income at age 70. It has to do with more than just “Delayed Retirement Credits” that the Social Security Administration gives us by delaying. In this case, it has to do with the “bucketing approach” that is represented by the new cash flow below in Chart 4.
Chart 4:
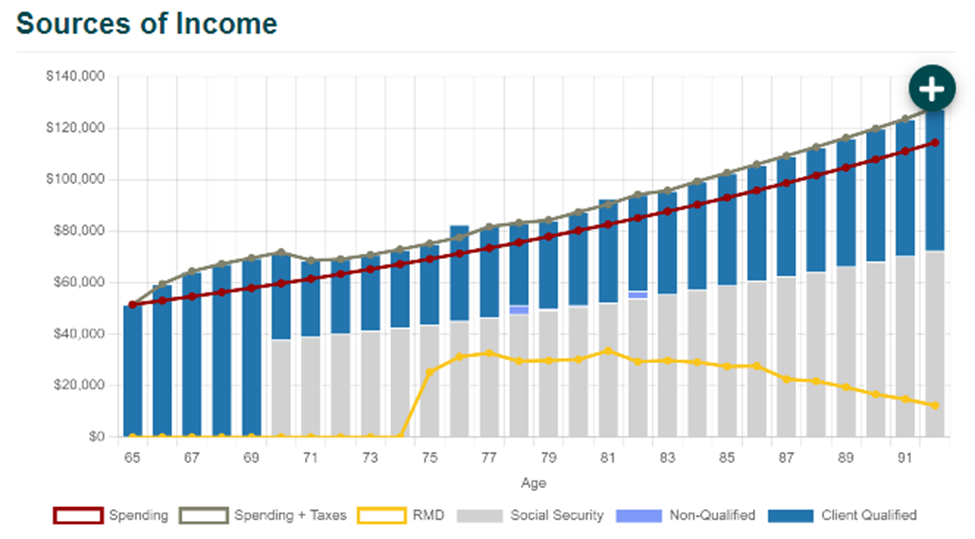
What I mean by “bucketing” is this. Relative to our first scenario, our dark blue bar is separated out from the grey bar, on a relative basis. By delaying Social Security until age 70, we are also becoming less reliant on portfolio income once that Social Security comes in. This is because the Social Security checks are so much larger via the “Delayed Retirement Credits.” And because we have less “pre-tax income” coming in at the same time we are taking our Social Security, it can decrease Johnny’s Provisional Income and thus his Social Security taxation. Don’t believe me? Check out Johnny’s PROJECTED Tax Returns in the year 2034 for each of the two scenarios.
Chart 5: The “Layering” Tax Return
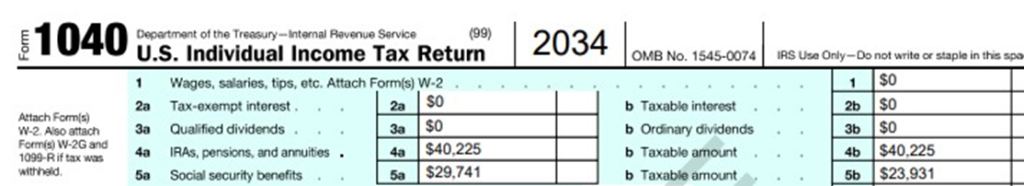
Notice in line 5a on his tax return that he received $29,741 in Social Security income but yet $23,931 was taxable!!! That is over 80% of his Social Security that is taxed? Why? Well again, because he was very reliant on the “Pre-Tax Income” represented in line 4a and 4b. Line 4b added to his provisional income, which also made his Social Security more taxable! The end result of all of this was, as shown in Chart 1, he falls $4,000 short of his $50,000 goal, on an after-tax basis.
Compare that tax return to the one below in Chart 6. The one below is using our “Bucketing Approach.”
Chart 6: The “Bucketing” Tax Return

Now, less than half of his Social Security is taxed. This is because he is less reliant on our 4a and 4b!!!
Concluding thoughts:
The “Bucketing Approach” may not give the most income in every scenario, especially those scenarios where the consumer is on one extreme side of the retirement income spectrum. However, speaking with consumers about the bucketing approach does have additional advantages, such as:
- During those “bridge years” between age 65 and 70 in our example, Johnny is spending down a significant amount of his pre-tax dollars. This oftentimes reduces his RMDs later on. Consumers hate RMDs if they don’t need the money!!!
- The tax rates assumed above are today’s tax rates. The case for “bucketing” becomes even more pronounced if we assume significant tax increases due to our fiscal situation. The end effect of the bucketing approach can be that Johnny is paying taxes on his pre-tax dollars earlier, when tax rates are possibly “on-sale.”
- The bucketing approach can also help in reducing “IRMAA,” which determines Medicare Premiums.
- You can see how this analysis oftentimes leads you to a conversation about Roth IRA conversions. If Johnny had all Roth IRA money rather than Traditional IRA money, this calculus completely changes.


0 Comments