
As the owner of this IMO – CG Financial Group – I always commit to bringing you unique content that you find valuable, whether you are an insurance agent, registered rep, IAR, RIA, etc. Content that is outside of the typical “product” regurgitating that you see everyday in your inboxes. This article is no exception. This article is a little bit on the actuarial side, so get out your financial calculators, spectacles, and your pocket protectors because we are going to have some fun with this article. In this article we are going to create a product. Of course, I am being somewhat facetious because there’s much more that goes into “creating a product” then just the numbers, such as: non-forfeiture requirements, state filing, illustration parameters, surrender charges, MVAs, utilization rates, etc. I do not pretend to be an actuary, but I am about as “actuarial” as a sales guy can come. My wife tells me that’s like being the tallest elf.
Regardless, this elf is going to show you the not-so-basics of creating an indexed annuity with a “cap” based off today’s (October 7th, 2022) interest rates and options prices. The purpose of this is to not make everybody actuaries (thank god!) but rather to enable you to easily answer many questions about these products by having a deep understanding of how they are created.
Here is the product we – the insurance company – are going to create. This will be a 10-year indexed annuity that utilizes an annual reset S&P 500 strategy. This strategy has a “cap” that we will need to figure out based off today’s interest rates and options costs. This product will have a 7% commission to the agent. Furthermore, we – the carrier – have shareholders that require a “return” on the company’s capital to the tune of 8% (more on this later).
Agenda:
- Determine how much we, the insurance company, can get in yield when we invest that client’s money.
- Based off our IRR requirements from the shareholders, how much of a “spread” do we shave off the top of the yield that we are getting in bullet point number one above.
- We then take what is left of the difference of number one and number two above and that determines our call option budget.
- We are “static hedging” this product and not utilizing “dynamic hedging”.
- We take our call option budget and we buy – and also sell – call options based off today’s option prices. Based off the pricing of call options, you and I will be able to identify what Cap Rate a person can get in today’s environment. Sounds pretty cool huh?
#1: How much Yield Do We Get?
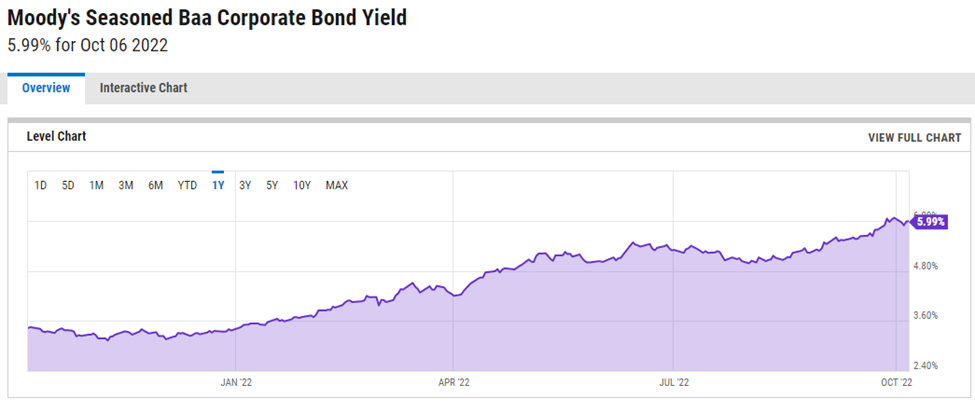
First off, when a carrier takes a client’s $100k (example), that carrier will invest almost all of that money in the bond market. Although a lot of folks use the 10-year treasury as “the benchmark” for the yield rate, a better benchmark is the Moody’s Baa bond yield. This is because carriers generally invest more in corporate bonds than they do in Treasury Bonds. Why? Because Corporate Bonds provide a higher yield. For instance, look at the chart below. This shows us an index of “investment grade” corporate bonds that represent a 5.99% yield. Remember how my wife called me “the tallest elf”? The Baa bond yield represents the shortest giants in the “investment grade” corporate bond market. Still investment grade but lower in quality the A – rated bonds, which means higher yield. Needless to say, the rate chart below is much better than the 10-Year Treasury Bond that is currently yielding 3.88%. Thus, the reason corporates are favored over treasuries.
Now that the insurance company knows that it can invest their money and earn approximately 6% on this money that is going into their “general account”, the carrier needs to allocate that money between the bonds and the call options. The bonds will be purchased to guarantee that the money grows back to $100,000 every single year, regardless of what the S&P 500 does. THIS IS HOW THE CARRIER IS ABLE TO SUPPORT THE POLICY GUARANTEES. The call option chunk will give the Indexed Annuity the “link” to the stock market in the up years. Again, Bonds = Guarantees and Options = Upside.
#2: The Carrier’s Cut
Before we calculate how much money goes to bonds and how much money goes to the call options, the carrier needs to take their cut… This is where the “carrier spread” comes in. That is, the carrier shaves a little off the top of that 6% (technically 5.99% in our example). That “spread” is how the carrier makes money. Ever been asked by a client, “so if the market skyrockets, the carrier kept everything above the cap?”. The answer is no. Carrier’s generally make their money off this spread, period!!! How much spread does the carrier require? It depends…
Our carrier has shareholders that require them to make a certain amount of money on the carrier’s capital. And make no mistake that putting a case on the books costs a carrier “capital.” Afterall, the carrier has to pay for the administration, paperwork, and the big one, agent commission. This is why if you have ever seen a carrier grow “too fast,” they will shut off new sales.
There are various measurements on the amount of “money” the carrier makes off their “investment,” such as Return on Investment (ROI) and Internal Rate of Return (IRR).
To simplify this, let’s say that we – the carrier – pay $7,000 to put our $100,000 on the books, or 7%. This is simplified because our agent commission is 7% and there are technically more expenses than that but bear with me!!! If the carrier shareholders demanded an 8% “Internal Rate of Return” over the 10-year life of our product, what annual income would be required for the carrier to achieve that? If you put this into your financial calculator, it would require $1,043 per year to the carrier (PV=-7,000, N=10, %=8, FV=0, solve for PMT). In other words, by the carrier “investing” $7,000 of their own money, in order to get an 8% return over the 10-year life of the product, that carrier would need 1.043% ($1,043) off the top of our 6%. Hence, a “spread” of 1.043%. Note: In corporate finance you learn that if the IRR is greater than the carrier’s “cost of capital,” it is a project that is worthwhile. Hence, if a carrier borrows money at 6% and gets an IRR on that money/capital at 8%, that is a product that has a positive “Net Present Value” and is good! By the way, me using a “cost of capital” example of 6% is on purpose!!! Remember, if the carrier was issuing bonds that are Baa rated for example, what yield would they have to offer their creditors? 5.99% per our chart above…
For the below, lets simplify the above and say that the carrier’s yield is 6% and the carrier spread that is required to keep the shareholders happy is simply 1%. No need to get crazy here with the decimals.
#3. Calculating the Call Option Budget
After the carrier takes it’s 1% off the top, we have 5% to play with for our client and their $100,000. This is where we need to divide the money between the bonds and the call options. The bonds need to guarantee $100,000 at the end of every year to – again – support the policy guarantees. So, what dollar amount needs to go into the bonds – earning 5% – so that those bonds in the general account grow back to $100,000 at the end of the year? Hint: The correct answer is NOT $95,000!!! The correct answer is $95,238. Thus, if you add 5% to $95,238, you will get $100,000. So, if the insurance carrier is investing $95,238 in bonds, what are they doing with the other $4,762? Call options. We have arrived at our call option budget.
Review:
What have we done so far? So far, we have designed the commission level on the product at 7%, We also calculated how much the carrier needs in “spread” to make the shareholders happy, and we have also arrived at our call option budget of 4.76% that will soon determine the cap. Note: ALL OF THESE CALCULATIONS REVOLVE AROUND THE INTEREST RATE OF 6% (TECHNICALLY 5.99%). THIS IS WHY INDEXED ANNUITY PRICING HAS GOTTEN BETTER OVER THE LAST YEAR IF YOU LOOK AT THE AFFOREMENTTIONED RATE CHART.
#4. Buying and Selling Call Options to Arrive at Our “Cap”
So, we have $4,762 to buy call options that link our client’s $100,000 to the S&P500. Said another way, although we are buying call options for $4,764, the return that we will get ultimately will be on a “notional value” of $100,000. That is how call options works. That is a call option budget of 4.76% of our $100,000. So, the first thing we want to do is look at the prices of call options on the S&P 500 (SPX). We want this call option to give us ALL of the upside of the S&P 500 between now and 12 months from now, because our product is an “annual reset”. Note: My discussion below is going to be largely about percentages. The exact dollar amounts to link the client’s $100,000 would be just a function of buying multiples of what we are talking about below. The exact dollar amounts are not important. The call option budget PERCENTAGES is important.
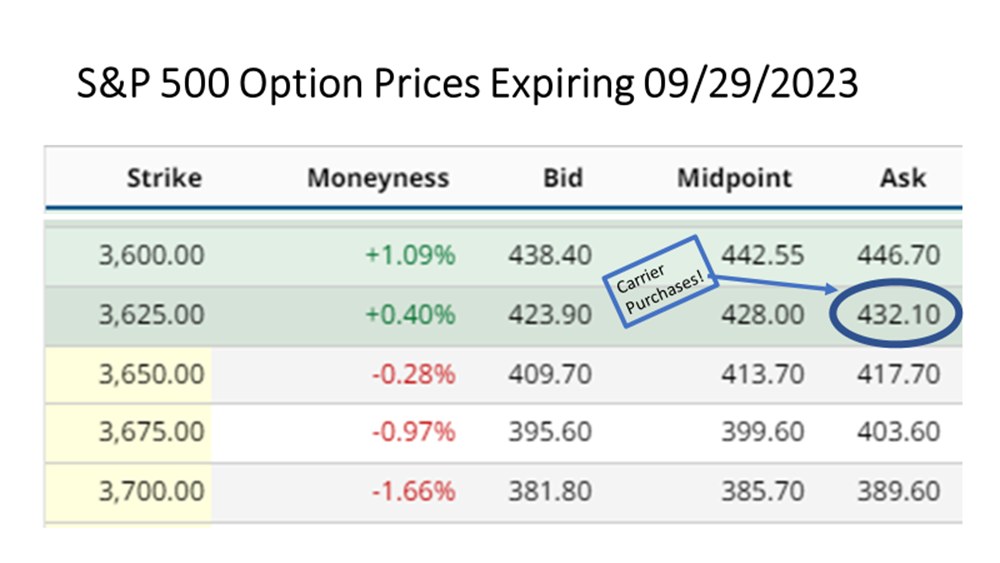
The chart above represents five rows – out of hundreds of rows – that represent today’s (10/8/22) option prices for an S&P 500 option that expires approximately one year from now. Because we want this option to give us growth on our client’s money from where the market is today (3,639), we need to find the “strike price” that is close to that number. In other words, we want to buy an “at the money” call option. So, we need to see what options sellers are “asking” for these options. It appears that we can buy an option for $432.10 on a S&P 500 value of 3,625. THIS CALL OPTION REPRESENTS A WHOPPING 11.92% (432.10 divided by 3,625) of the “Notional Value” that is linked to the market!!! We have a problem here because our options budget is only 4.76%.
No fear, there is a solution here. That solution is, that we can buy this option but then immediately SELL another option that will give us back approximately 7.16%. This will ensure that our net options cost is only 4.76%. In other words, by us buying an option for 11.92% and selling one for 7.16%, our total NET cost will be our options budget of 4.76%. (11.92% – 7.16% = 4.76%).
So above, lets buy the “at the money” option for 11.92% of the “notional value.”
Selling a Call Option
As you can see in the options pricing tables above or below, the higher the “strike price” on call options, the cheaper they are. It is because the “strike price” represents the point in time where the option purchaser actually starts making money. Hence, “in the money.” So, if we are selling a call option, we want to go as far down the “strike price” as we can. This is because when the market increases to that number, which is the point that we will be giving the upside to somebody else!!! Ideally, we would just purchase the option that we already did above and not have to sell a call option. However, we don’t have the large call option budget to do that, therefore we must sacrifice some upside. So, let’s go down the list and see what we need to sell. We need to produce about $259.55 (7.16% of 3,625) so that we net out to our 4.76% budget.
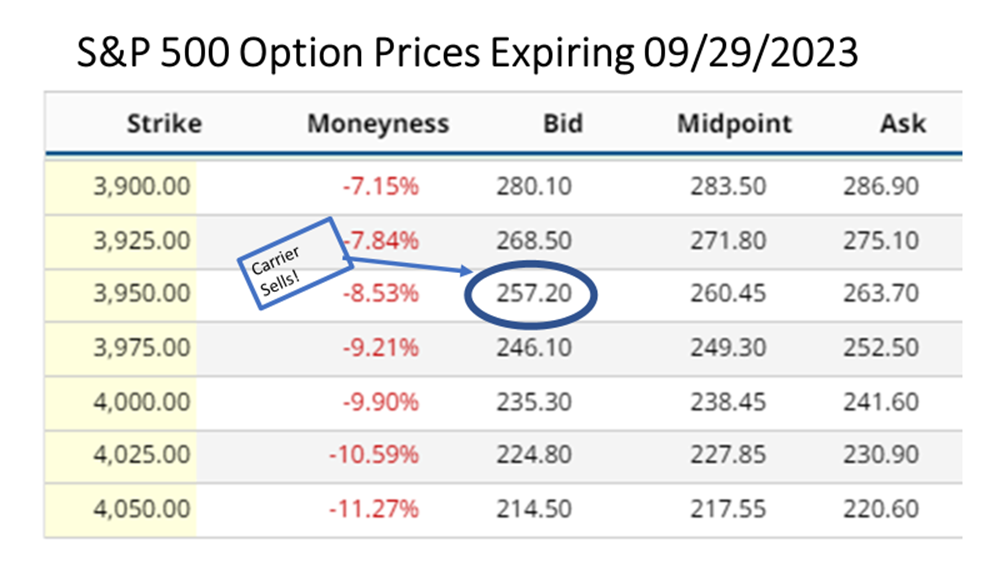
We found something close!!! We can sell an option for $257.20 at a strike price of 3,950. What does this mean?
- We netted out to a cost of 174.90 (Paid $432.10 – Sold $257.20). This represents something very close to our call option budget – 4.82% (174.90 divided by 3,625)
- We just created a product with an approximate “CAP” of 9%. This is because we are participating in the upside of the market starting at 3,625 (first chart) and handing off the upside “participation” in the market once it crosses over 3,950. 3,950 is approximately 9% (8.97% technically) higher than 3,625.
What we have just done is created an indexed annuity that:
- Guarantees the client’s money will never be lost. This is because the carrier has the bonds that grow back the money to $100,000 every year, ASSUMING RATES STAY THE SAME.
- Gives the shareholders their “IRR” , ASSUMING RATES STAY THE SAME.
- Gives the carrier a 4.76% call option budget to buy the call options after they expire every year, ASSUMING RATES STAY THE SAME.
- Gives the carrier upside potential of 9% that they can pass through to the client in the form of a “CAP”.
- Pays the agent a 7% commission.
Although my calculations are my own calculations and not specific to a carrier, the product I just explained with those caps, commission rates, etc, really DOES exist today. So, those calculations are not pie in the sky.
Technically, one of my favorite products is the same as what I laid out here, except the A-Rated carrier just announced a cap increase to 10.75% for premiums over $100k!!! How can they do that? Numerous ways. Maybe the carrier is demanding less “spread” for themselves. Or maybe the carrier is able to get investments at higher yields than my 6%. Both of these would mean more call option budget.
I am fully cognizant that this was a three-coffee article for you to read, but I promise you, if you are serious about indexed products, this article will help you in the future when it comes to answering questions about “how do the carriers do it?.”


0 Comments