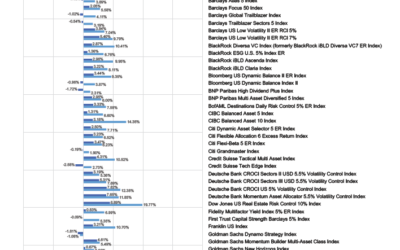
This is a great bar graph that shows the performance of many of the volatility controlled indices that exist within indexed annuities and indexed life. Of course, these are merely the “indexes” and do not reflect the participation rates, caps, etc that exist within the product itself. However, none of that makes any difference in almost all of these cases because the all (almost) are negative!!! The fact that almost all volatility controlled strategies are down speaks to how broad the selloff over the last year has been in both, stocks and bonds. Afterall, bonds are usually the factor that “controls” the volatility in these indices.
The good news is, A: the 0% that you got in these indexed products is better than the alternative. And B: For the “annual reset” products, the new year is starting from the low index level.
Also, for more on volatility controlled strategies, here is an article you may be interested in.


0 Comments